如何建構知識圖譜
在本指南中,我們將介紹基於非結構化文本建構知識圖譜的基本方法。然後,建構好的圖譜可以用作 RAG 應用程式中的知識庫。
⚠️ 安全注意事項 ⚠️
建構知識圖譜需要執行對資料庫的寫入權限。這樣做存在固有的風險。請確保在匯入資料之前驗證和確認資料。有關一般安全最佳實務的更多資訊,請參閱此處。
架構
從文本建構知識圖譜的高階步驟如下
- 從文本中提取結構化資訊:模型用於從文本中提取結構化圖譜資訊。
- 儲存到圖形資料庫:將提取的結構化圖譜資訊儲存到圖形資料庫中,可支援下游 RAG 應用程式
設定
首先,取得所需的套件並設定環境變數。在本範例中,我們將使用 Neo4j 圖形資料庫。
%pip install --upgrade --quiet langchain langchain-neo4j langchain-openai langchain-experimental neo4j
[1m[[0m[34;49mnotice[0m[1;39;49m][0m[39;49m A new release of pip is available: [0m[31;49m24.0[0m[39;49m -> [0m[32;49m24.3.1[0m
[1m[[0m[34;49mnotice[0m[1;39;49m][0m[39;49m To update, run: [0m[32;49mpip install --upgrade pip[0m
Note: you may need to restart the kernel to use updated packages.
在本指南中,我們預設使用 OpenAI 模型。
import getpass
import os

os.environ["OPENAI_API_KEY"] = getpass.getpass()

# Uncomment the below to use LangSmith. Not required.
# os.environ["LANGSMITH_API_KEY"] = getpass.getpass()
# os.environ["LANGSMITH_TRACING"] = "true"
········
接下來,我們需要定義 Neo4j 憑證和連線。請依照這些安裝步驟設定 Neo4j 資料庫。
import os

from langchain_neo4j import Neo4jGraph

os.environ["NEO4J_URI"] = "bolt://127.0.0.1:7687"
os.environ["NEO4J_USERNAME"] = "neo4j"
os.environ["NEO4J_PASSWORD"] = "password"

graph = Neo4jGraph(refresh_schema=False)
LLM 圖譜轉換器
從文本中提取圖譜資料可以將非結構化資訊轉換為結構化格式,從而更深入地了解複雜的關係和模式,並更有效地導航。LLMGraphTransformer 透過利用 LLM 解析和分類實體及其關係,將文檔轉換為結構化圖譜文檔。LLM 模型的選擇顯著影響輸出,決定了提取的圖譜資料的準確性和細微差別。
import os

from langchain_experimental.graph_transformers import LLMGraphTransformer
from langchain_openai import ChatOpenAI

llm = ChatOpenAI(temperature=0, model_name="gpt-4-turbo")

llm_transformer = LLMGraphTransformer(llm=llm)
現在我們可以傳入範例文本並檢查結果。
from langchain_core.documents import Document

text = """
Marie Curie, born in 1867, was a Polish and naturalised-French physicist and chemist who conducted pioneering research on radioactivity.
She was the first woman to win a Nobel Prize, the first person to win a Nobel Prize twice, and the only person to win a Nobel Prize in two scientific fields.
Her husband, Pierre Curie, was a co-winner of her first Nobel Prize, making them the first-ever married couple to win the Nobel Prize and launching the Curie family legacy of five Nobel Prizes.
She was, in 1906, the first woman to become a professor at the University of Paris.
"""
documents = [Document(page_content=text)]
graph_documents = llm_transformer.convert_to_graph_documents(documents)
print(f"Nodes:{graph_documents[0].nodes}")
print(f"Relationships:{graph_documents[0].relationships}")
Nodes:[Node(id='Marie Curie', type='Person', properties={}), Node(id='Pierre Curie', type='Person', properties={}), Node(id='University Of Paris', type='Organization', properties={})]
Relationships:[Relationship(source=Node(id='Marie Curie', type='Person', properties={}), target=Node(id='Pierre Curie', type='Person', properties={}), type='MARRIED', properties={}), Relationship(source=Node(id='Marie Curie', type='Person', properties={}), target=Node(id='University Of Paris', type='Organization', properties={}), type='PROFESSOR', properties={})]
查看以下圖像,以更好地理解產生的知識圖譜的結構。
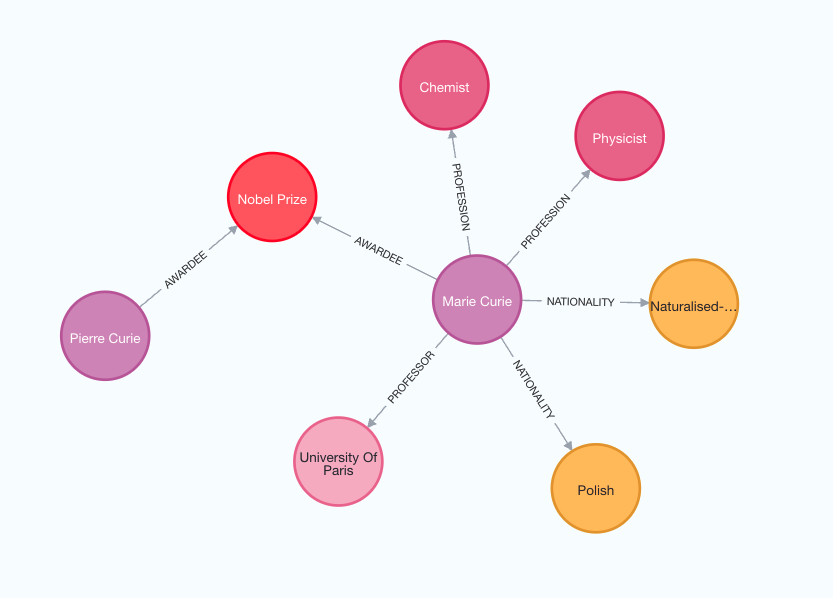
請注意,由於我們使用 LLM,圖譜建構過程是非確定性的。因此,每次執行您可能會得到略有不同的結果。
此外,您可以靈活地定義要提取的特定節點和關係類型,以符合您的需求。
llm_transformer_filtered = LLMGraphTransformer(
    llm=llm,
    allowed_nodes=["Person", "Country", "Organization"],
    allowed_relationships=["NATIONALITY", "LOCATED_IN", "WORKED_AT", "SPOUSE"],
)
graph_documents_filtered = llm_transformer_filtered.convert_to_graph_documents(
    documents
)
print(f"Nodes:{graph_documents_filtered[0].nodes}")
print(f"Relationships:{graph_documents_filtered[0].relationships}")
Nodes:[Node(id='Marie Curie', type='Person', properties={}), Node(id='Pierre Curie', type='Person', properties={}), Node(id='University Of Paris', type='Organization', properties={})]
Relationships:[Relationship(source=Node(id='Marie Curie', type='Person', properties={}), target=Node(id='Pierre Curie', type='Person', properties={}), type='SPOUSE', properties={}), Relationship(source=Node(id='Marie Curie', type='Person', properties={}), target=Node(id='University Of Paris', type='Organization', properties={}), type='WORKED_AT', properties={})]
為了更精確地定義圖譜架構,請考慮對關係使用三元組方法。在這種方法中,每個元組由三個元素組成:來源節點、關係類型和目標節點。
allowed_relationships = [
    ("Person", "SPOUSE", "Person"),
    ("Person", "NATIONALITY", "Country"),
    ("Person", "WORKED_AT", "Organization"),
]

llm_transformer_tuple = LLMGraphTransformer(
    llm=llm,
    allowed_nodes=["Person", "Country", "Organization"],
    allowed_relationships=allowed_relationships,
)
graph_documents_filtered = llm_transformer_tuple.convert_to_graph_documents(documents)
print(f"Nodes:{graph_documents_filtered[0].nodes}")
print(f"Relationships:{graph_documents_filtered[0].relationships}")
Nodes:[Node(id='Marie Curie', type='Person', properties={}), Node(id='Pierre Curie', type='Person', properties={}), Node(id='University Of Paris', type='Organization', properties={})]
Relationships:[Relationship(source=Node(id='Marie Curie', type='Person', properties={}), target=Node(id='Pierre Curie', type='Person', properties={}), type='SPOUSE', properties={}), Relationship(source=Node(id='Marie Curie', type='Person', properties={}), target=Node(id='University Of Paris', type='Organization', properties={}), type='WORKED_AT', properties={})]
為了更好地理解產生的圖譜,我們可以再次將其視覺化。
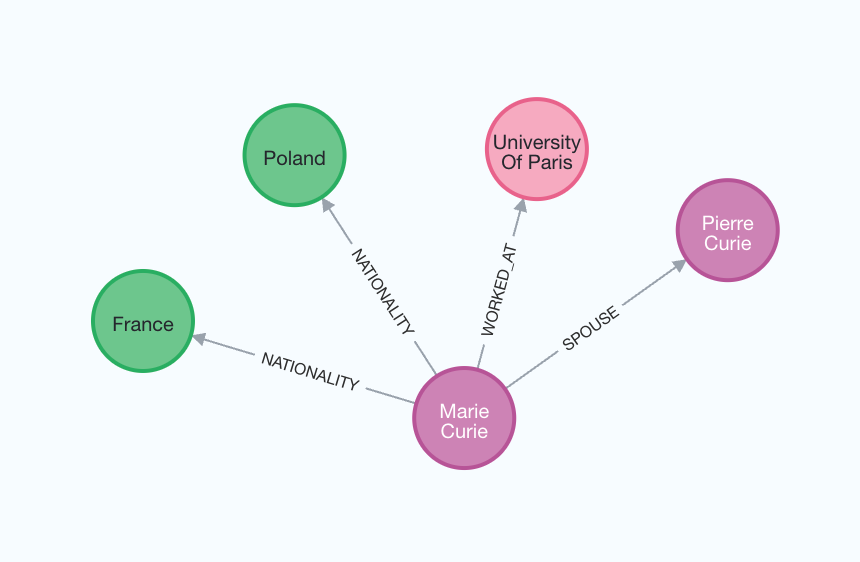
node_properties 參數可以提取節點屬性,從而建立更詳細的圖譜。當設定為 True 時,LLM 會自動識別和提取相關的節點屬性。相反地,如果 node_properties 定義為字串列表,則 LLM 只會從文本中選擇性地檢索指定的屬性。
llm_transformer_props = LLMGraphTransformer(
    llm=llm,
    allowed_nodes=["Person", "Country", "Organization"],
    allowed_relationships=["NATIONALITY", "LOCATED_IN", "WORKED_AT", "SPOUSE"],
    node_properties=["born_year"],
)
graph_documents_props = llm_transformer_props.convert_to_graph_documents(documents)
print(f"Nodes:{graph_documents_props[0].nodes}")
print(f"Relationships:{graph_documents_props[0].relationships}")
Nodes:[Node(id='Marie Curie', type='Person', properties={'born_year': '1867'}), Node(id='Pierre Curie', type='Person', properties={}), Node(id='University Of Paris', type='Organization', properties={}), Node(id='Poland', type='Country', properties={}), Node(id='France', type='Country', properties={})]
Relationships:[Relationship(source=Node(id='Marie Curie', type='Person', properties={}), target=Node(id='Poland', type='Country', properties={}), type='NATIONALITY', properties={}), Relationship(source=Node(id='Marie Curie', type='Person', properties={}), target=Node(id='France', type='Country', properties={}), type='NATIONALITY', properties={}), Relationship(source=Node(id='Marie Curie', type='Person', properties={}), target=Node(id='Pierre Curie', type='Person', properties={}), type='SPOUSE', properties={}), Relationship(source=Node(id='Marie Curie', type='Person', properties={}), target=Node(id='University Of Paris', type='Organization', properties={}), type='WORKED_AT', properties={})]
儲存到圖形資料庫
可以使用 add_graph_documents 方法將產生的圖譜文檔儲存到圖形資料庫中。
graph.add_graph_documents(graph_documents_props)
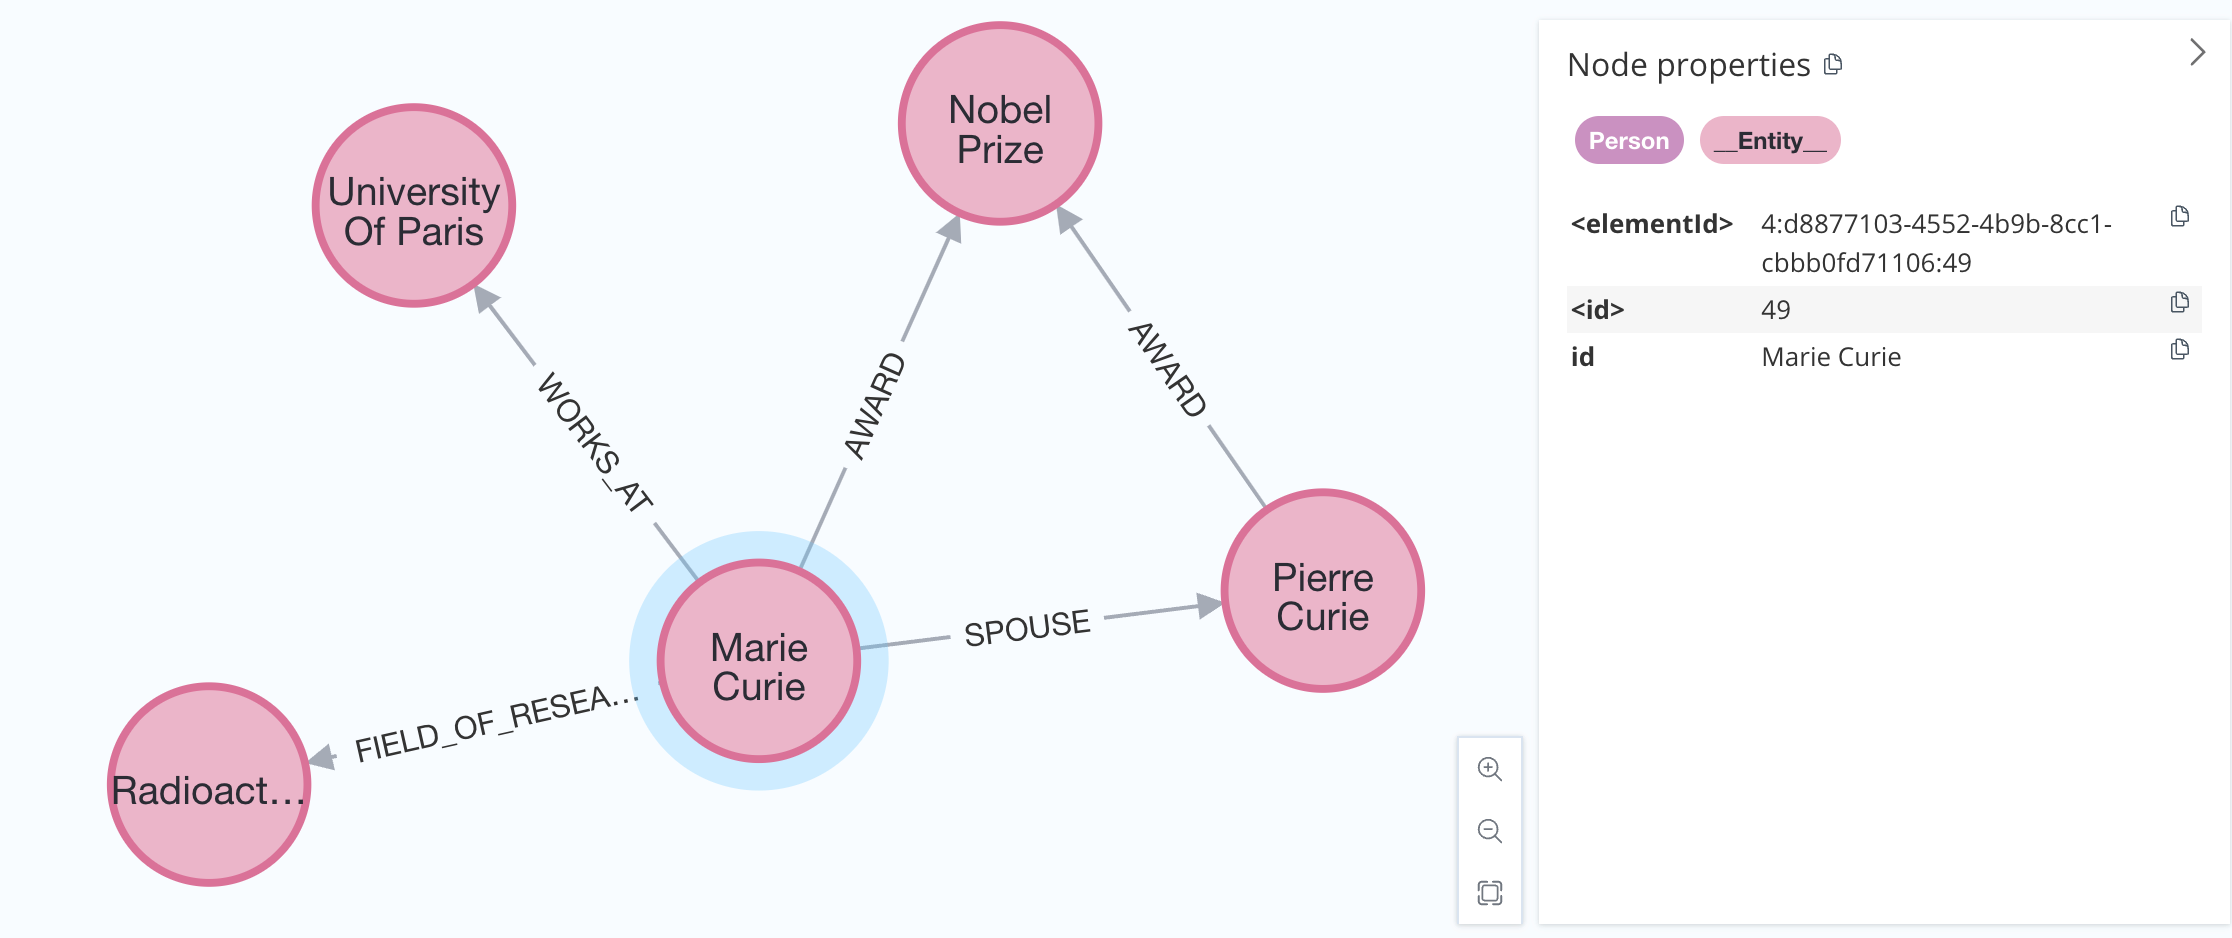
大多數圖形資料庫都支援索引,以最佳化資料匯入和檢索。由於我們可能事先不知道所有節點標籤,因此我們可以透過使用 baseEntityLabel 參數為每個節點新增輔助基本標籤來處理此問題。
graph.add_graph_documents(graph_documents, baseEntityLabel=True)
結果將如下所示
最後一個選項是也匯入提取的節點和關係的來源文檔。這種方法讓我們可以追蹤每個實體出現在哪些文檔中。
graph.add_graph_documents(graph_documents, include_source=True)
圖譜將具有以下結構
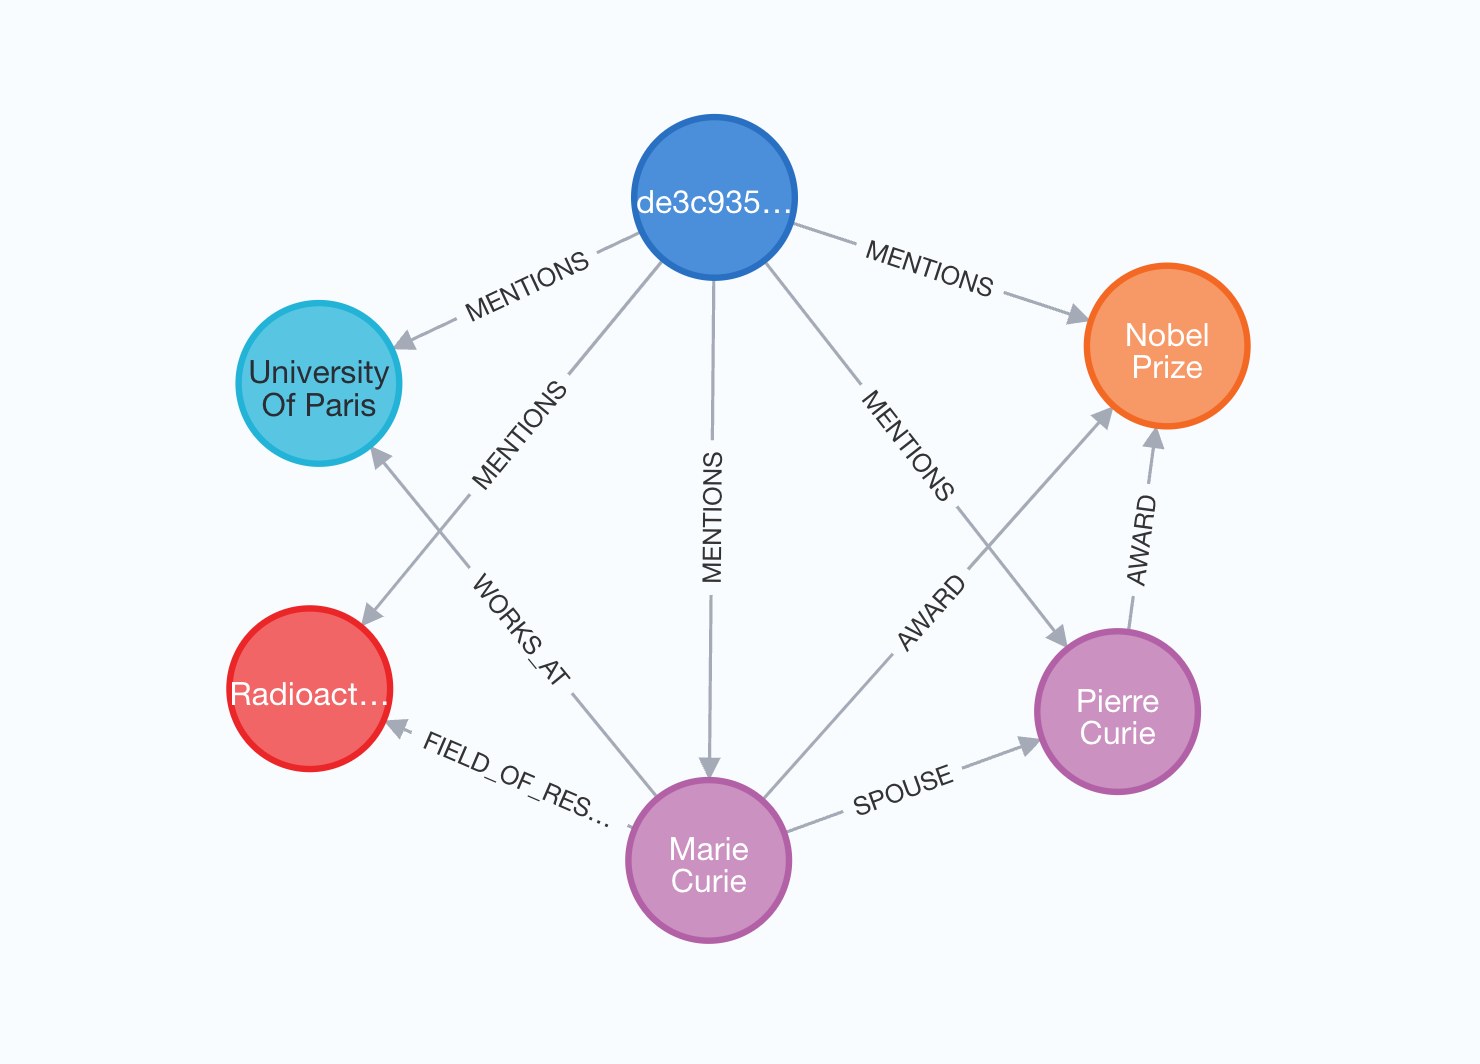
在此視覺化中,來源文檔以藍色突出顯示,從其中提取的所有實體都透過 MENTIONS 關係連接。